It's been a while since I wrote about a GIS tool. Sometimes when I'm working with geographic data the need arises to create a set of repeating shapes and I look for tools to automate it. In ArcGIS, the best I've found is Repeating Shapes for ArcGIS by Jeff Jenness.
Very easy to download and install and then you can get started. Some example images below based on hexagons and the documentation pdf.
New data on regional gross domestic product (GDP) was published by Eurostat yesterday. It is for the year of 2008 and covers the 27 Member States. When you look at the data for NUTS 2 level the results are very interesting. When you account for purchasing power standards and index the EU average at 100, the highest figure is Inner London, at 343. The lowest figure is for the Bulgarian region of Severozapaden - officially the poorest region in the EU by this measure.
Here's how it looks on the map...
Clearly, the eastern and southern parts of the EU territory are 'poorest' by this measure and there are some major concentrations of low values in the accession states - particularly in Bulgaria and Romania. Of the 64 regions with a GDP of below 75% of the EU average, here's where they are:
"Among the 64 regions below the 75% level, fifteen were in Poland, seven each in the Czech Republic and Romania, six each in Bulgaria and Hungary, four each in Italy and Portugal, three each in Greece, France (all overseas departments) and Slovakia, two in the United Kingdom, one in Spain, as well as Estonia, Latvia and Lithuania."
Within the UK, there is significant variation, from 71 in West Wales and the Valleys to 343 in Inner London, though it is worth pointing out that GDP data is affected by commuting patterns, particularly in areas of high in-commuting like Inner London. Nonetheless, here's how it looks on the chart...
As you'd expect, this new data has led to various news stories, including this one by the BBC. The data on GDP are never as up to date as we'd like, but it is interesting looking across the regions of the EU and particularly so when we map it.
Over the past few years there has been a growing awareness of the ways in which technology can help cities work more effectively and efficiently. One major initiative in this vein is IBM's Smarter Cities project/programme, which is all about being 'smart' as cities grow and grow and consume more of the world's resources.
Why IBM are doing this, the rationale behind it and the steps they are actually taking are on their website, but here's how they start explaining it all:
"In 1900, only 13% of the world's population lived in cities. By 2050, that number will have risen to 70%. We are adding the equivalent of seven New Yorks to the planet every year.
This unprecedented urbanisation is both a sign of our economic and societal progress and a strain on the planet's infrastructure. It's a challenge felt by mayors, heads of economic development, our schools, police chiefs and other leaders who each help to build and support the communities in which we live.
The challenges these leaders face — educating the young, keeping citizens safe and healthy, attracting and facilitating commerce, and enabling the smooth flow of planes, trains, cars and pedestrians — are compounded by the global economic downturn.
Thankfully, help is at hand. Around the world, intelligence is being infused into the way our cities work."
For more on the above, see the short pdf document...
I've just highlighted the UK section of the IBM Smarter Cities site here but it does refer to places across the globe and in the Case Study section you can see examples from Alameda, Queensland and Madrid, among other places. There's even a story about 'CovJam' - click the link to find out more and watch the video below!
The IBM site is certainly worth a look...
There is a special conference on this theme at MIT in April, called Forum on Future Cities, which is likely to be very interesting.
Once upon a time, when you put the search term 'UHI' into google, you might have been left with a lot of results about urban heat islands. Now, searching for 'UHI' (from within the UK) will lead you towards the University of the Highlands and Islands website. It's been a long time coming but it only officially became a University in February 2011.
Why do I care, and why am I writing about this? Because I'm from the Highlands, I studied the structure and location of UHI during my MA dissertation research and - most importantly - there has never been a University in this area before. The Highland local authority area is not quite the same as the area covered by UHI, but even on its own it is bigger than Belgium (coincidentally, where I'm going today) - so it meant that young people often had to leave if they wanted to go to University. Now they have a choice.
The University is comprised of 13 different institutions, spread throughout the Highlands and Islands, from Shetland in the far north to Perth in the south. The range of courses is slightly different from other universities and it includes education in Gaelic too.
I'm very happy about this development, though in the history of higher education in Scotland and the UK it could have arrived at a better time!
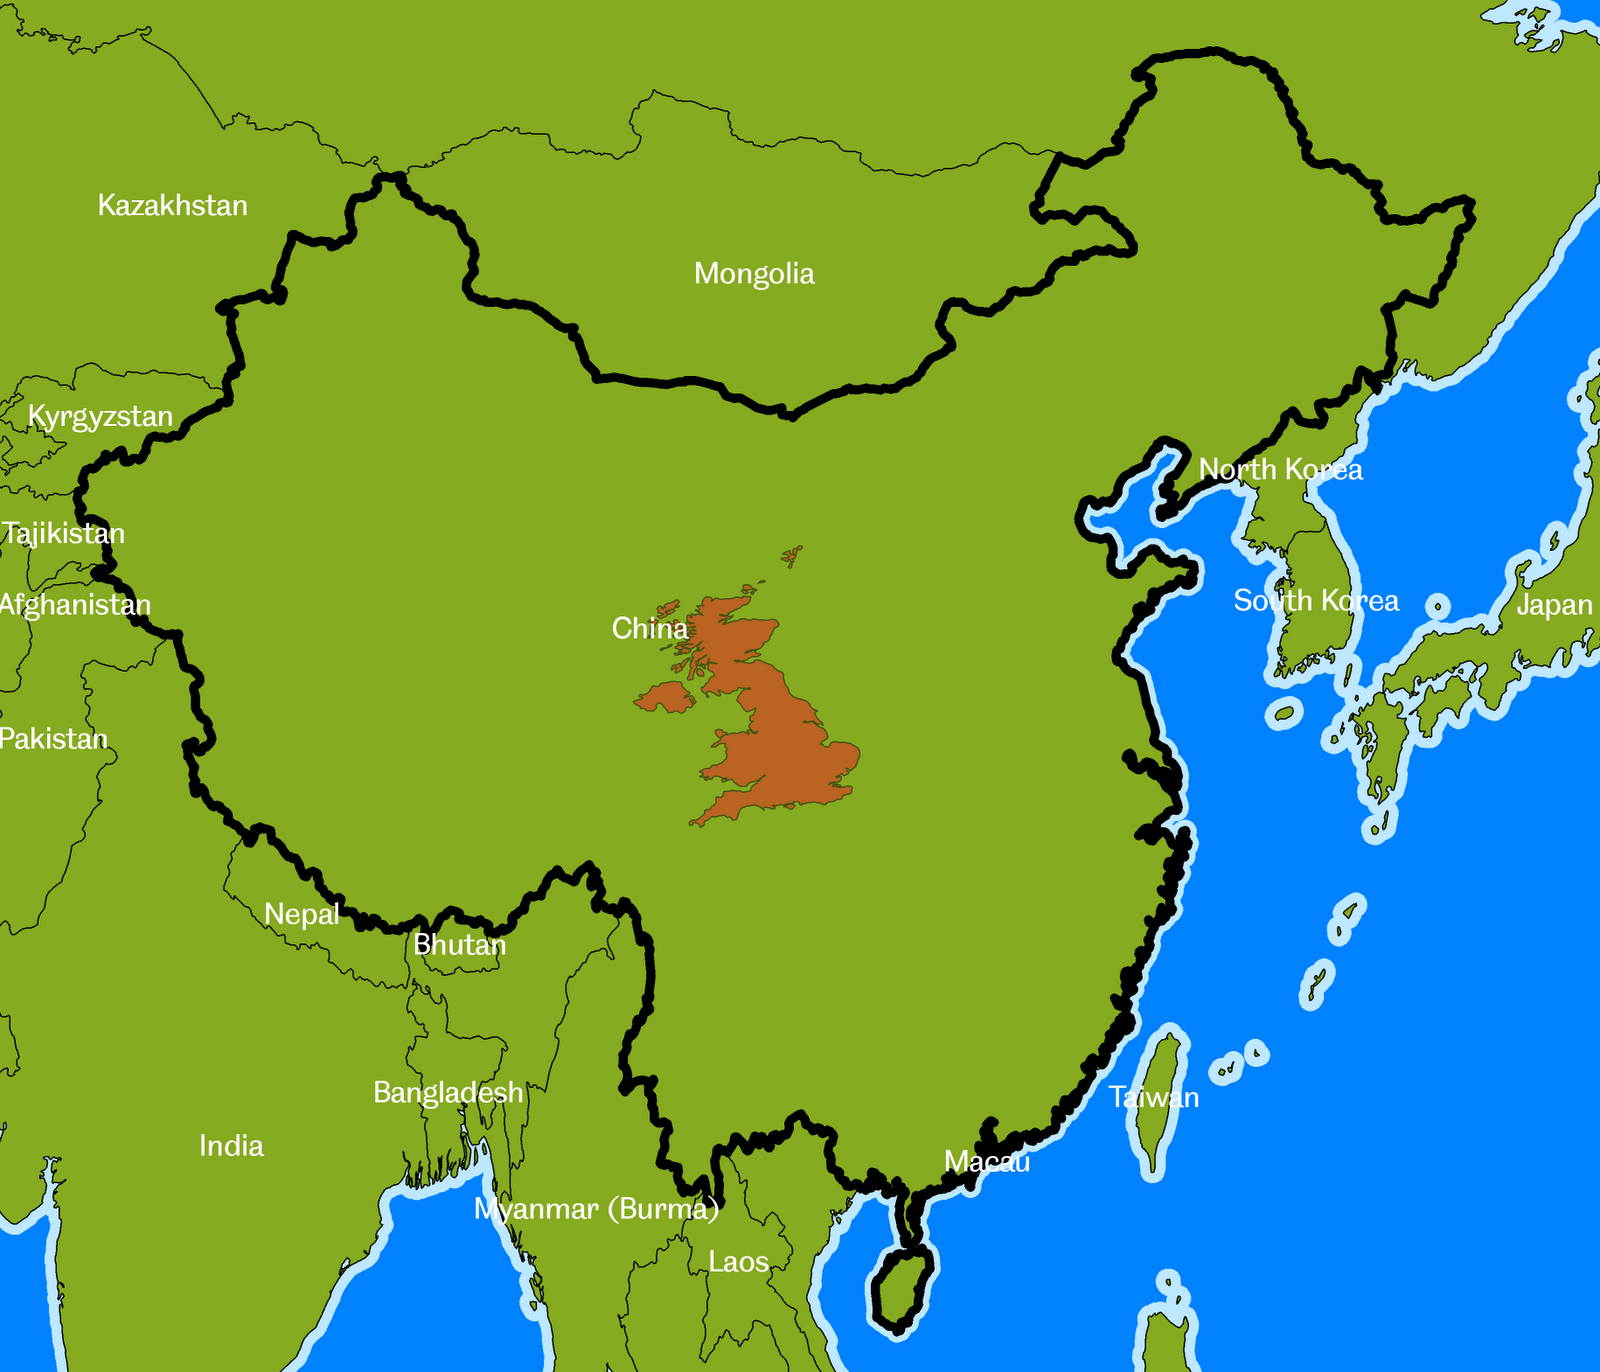
Following on from the theme of a recent post, about the size of different countries, I thought it would be interesting to compare the size of the United Kingdom to other parts of the world. The UK covers an area of about 243,000 square km., which is quite big in some ways, but not so big in others (ask any Canadian). It's all a matter of perspective. Some maps and facts below, with the UK superimposed on different parts of the world. Click the maps to see them in full size.
Russia is 70 times larger than the UK
Canada is about 41 times larger than the UK
The USA and China are both approximately 40 times larger than the UK
Brazil is 35 times bigger than the UK
Australia is about 32 times bigger than the UK
India is 13 times bigger
Sudan is 10 times bigger (n.b. now split in two since I originally wrote this)
Iran is 7 times bigger
France is twice as big (this is just the European part, not the overseas départements)
NOTES: I've used an equal area projection so there is a bit more map distortion than I'd like but this was just a bit of fun to make a point and remind myself of the relative size of the UK. For the USA I've shown the continental US and Alaska on separate maps. I've not shown Hawaii this time.
I've not blogged on e-learning stuff for a while so time for a new one. Today I'm speaking at the University of Sheffield's annual Learning and Teaching conference. My talk is all about integrating 'low-tech' technology into teaching - the slides are online too. One thing I'm doing is demonstrating Poll Everywhere for audience response in lectures (screenshot of home page below).
It can often be very useful to get feedback from students during or at the end of teaching sessions. Since the vast majority of students now have mobile phone deals with unlimited texts or can get online via their phones, Poll Everywhere is making a real impact in this area. It's very easy to use and it is free for classes of up to 32 students. An example below of how you can also embed the polls in web pages... If you click an option below you can see the results of this crucial poll!
Many universities in the UK (e.g. Brighton, Greenwich) are now using Poll Everywhere, so it may be here to stay. I think it is a very effective tool for quick feedback from students.
Just in case you missed it, 2010 was the year for tackling poverty and social exclusion in Europe, according to Eurocities - well, actually the European Commission, but Eurocities agree! There is a very interesting video about all this - see below. Some interesting examples in the video from across Europe.
What is Eurocities? Here's what they say...
EUROCITIES is the network of major European cities. We bring together the local governments of more than 140 large cities in over 30 European countries.
We influence and work with the EU institutions to respond to common issues that impact the day-to-day lives of Europeans. Our aim is to shape the opinions of stakeholders in Brussels to ultimately shift legislation in a way that helps city governments address the EU's strategic challenges at the local level. A large part of our work is aimed at reinforcing the role and place that local government should have in a multi-level governance structure.
Based on the EU's three key challenges, EUROCITIES' policy priorities are:
This blog featured data, maps and stories related to my research between 2008 and 2015. I've decided to move on to other things, but I'll leave all content as it is now in case anyone is interested. The focus was normally on things to do with cities, GIS and spatial data analysis. If you want to use any of the material on here just ask, as I'm generally okay with it.